
NETWORKS and NAVIGATORS
Pegasus handles large Microwave based Transmission Networks with projects that can include thousand of Microwave Links, where link identification can become a time consuming exercise detrimental to productivity. Our powerful Network Selector and Navigators address this issue
In the Network Selector Microwave Links are segregated can be grouped into different Networks according to user defined criteria such as:
-
 Links operating in the same Frequency band
 -
Links having the same usage
-
Links within the same Geographical / administrative area
or OTHER rules according to your preferences …
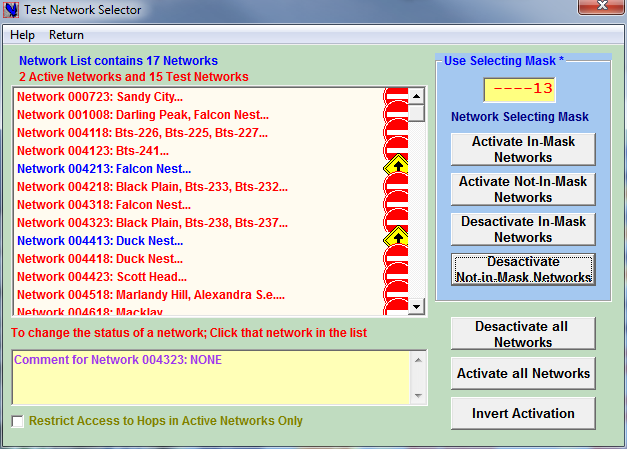
Network filtering options enable to temporarily exclude undesirable Networks and only concentrate on the links of interest.
Furthermore, the tool offers a range of various features assisting the navigation in the pool of links and networks to effectively find THE wanted link; Several navigator engines are available
The “Tree GoTo” Navigator
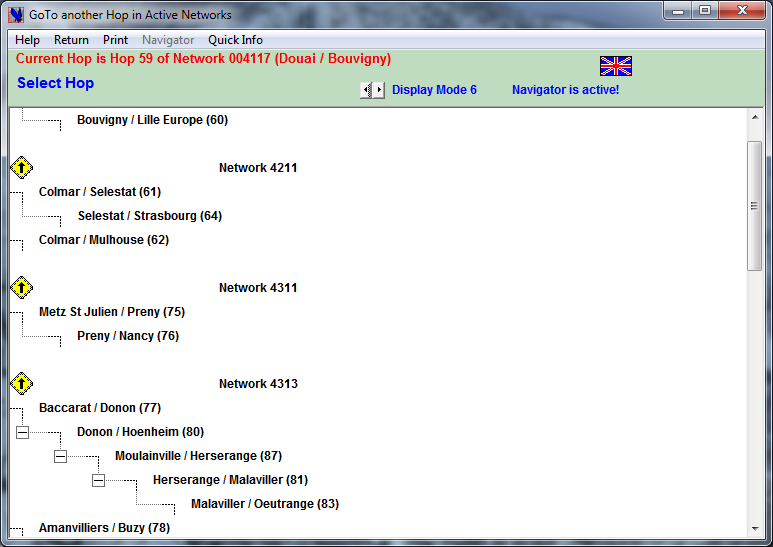
“Family Tree” GoTo
← “GoTo / Tree GoTo” sub-menu present in several windows.
Displays the hierarchical tree of the project, the microwave links are grouped by Networks
Just click the Station Name and then the “Return menu”: you will be returned to the window of origin that will now display the Microwave Link where the chosen Station is present.
The “Name GoTo” Navigator
“GoTo/Name GoTo” sub-menu present in several windows. →
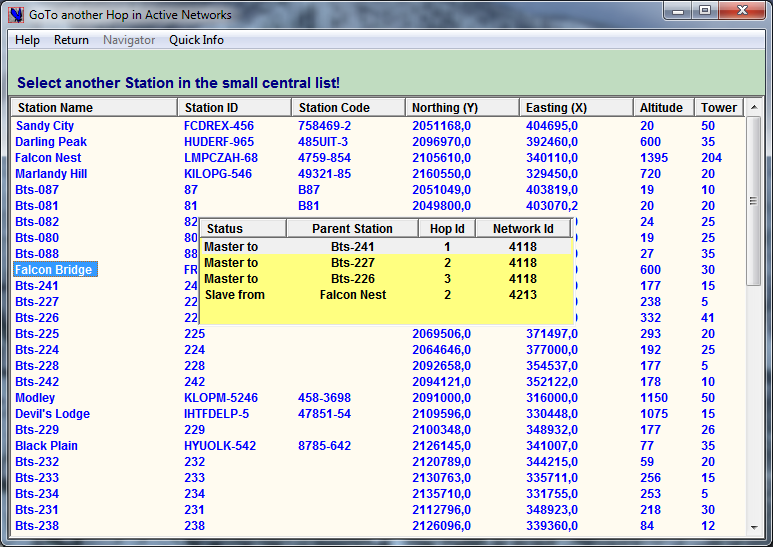
Name GoTO navigator
Just click the Station Name and then the “Return menu”: you will be returned to the window of origin that will now display the Microwave Link where the chosen Microwave Link Station is present.
If the Station is part of several links those links will be listed in a separate container. Just click the line corresponding to the desired Microwave Link
The Network Map Navigator
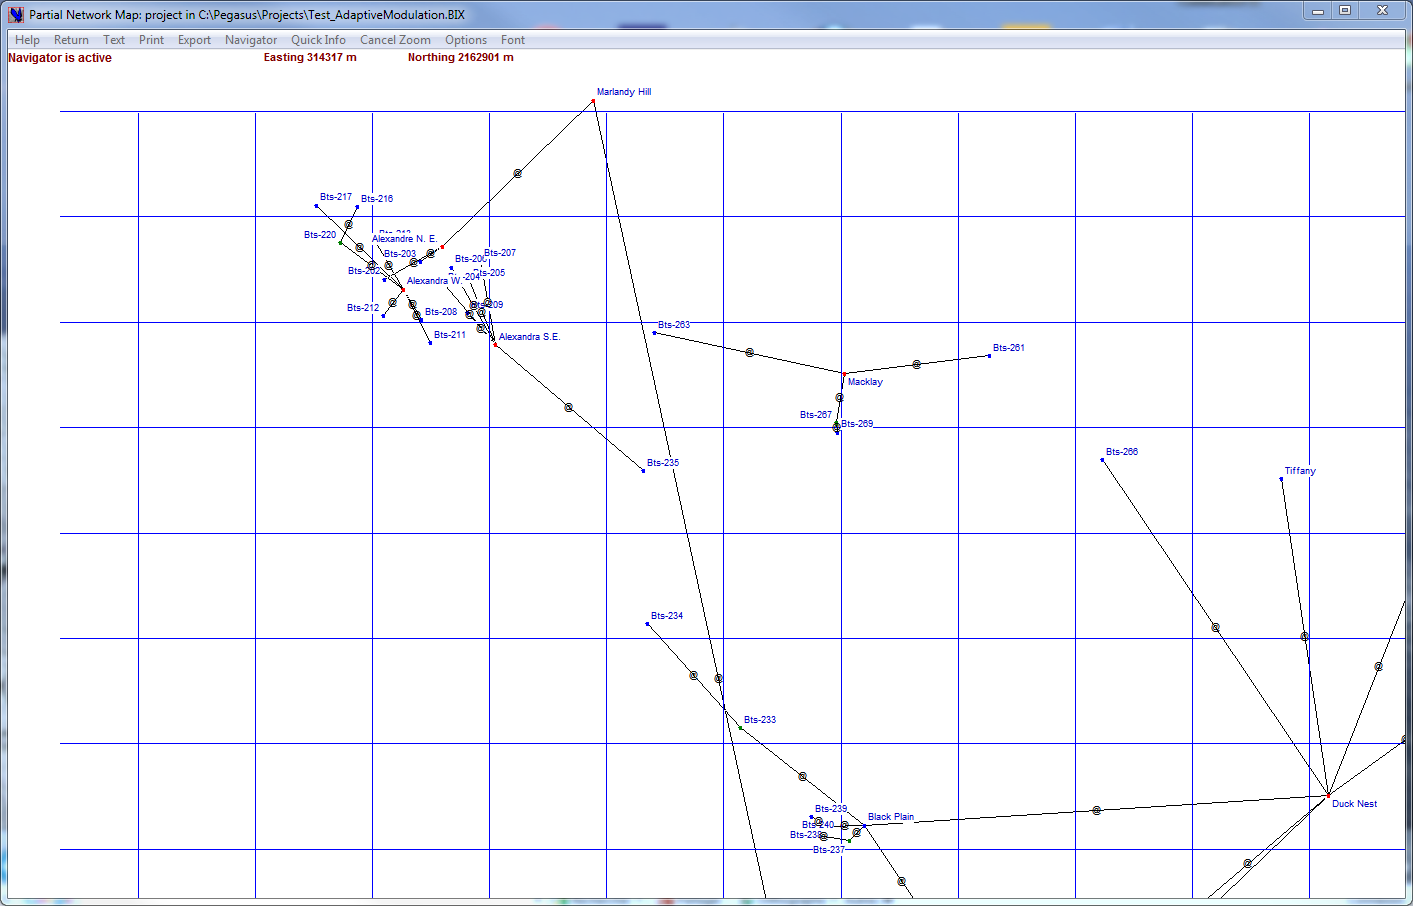
Netwok Map navigator
←“Show/Map Show” Sub-menu present in some windows.Click the @ that is in the middle of a each hop: you will be returned to the window of origin that will now display the Microwave Link.
Note that this works also with the Zoomed Network Map as shown here.
From those Network Map you can also set the Quick Info option (Quick Info menu): by clicking the @ the Quick Info window will appears and give express information on the selected link.
The Next-Previous Navigator is present in some windows and appears as two separate menu items. The Next-Previous navigation will lead you along the branch of the Hierarchical Tree on which the current microwave link is located. Note that this Navigator is well adapted to navigate along a backbone; to navigate between sister links of a nodal station it is more convenient to use the “Name GoTo” Navigator
DEFINITION OF MICROWAVE LINK PARAMETERS
The Link Parameters Selector Main Window enables to:
-
Assign the equipment parameters to the current Microwave Link (MW type, configuration, capacity, modulation … and to
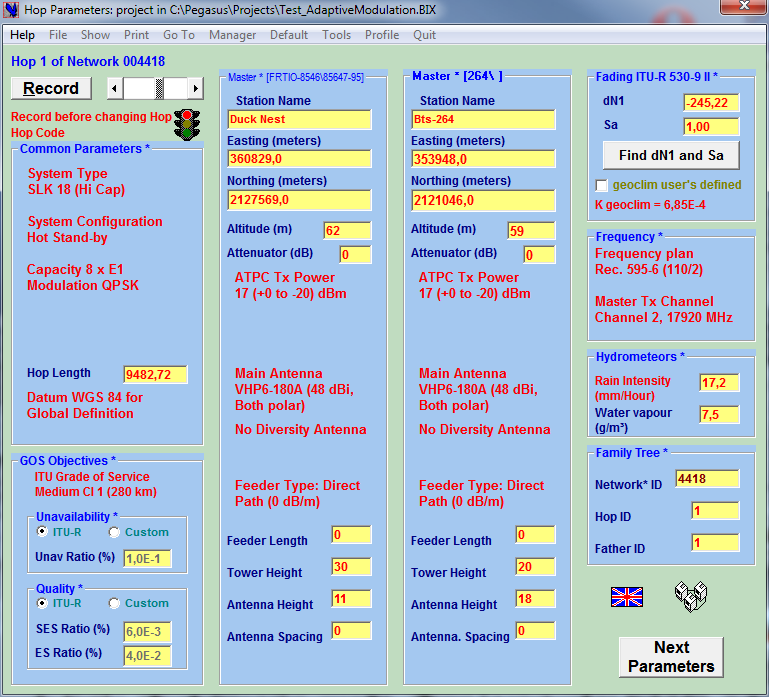
Hop Parameters
choose the ancillary equipment of the current MW Link (feeders, antennas)
-
Assign Station Names and Coordinates
-
Define the Quality and Availability objectives
-
Set some values (effective TX power, feeder length, antenna height, Frequency Plan & 1st Channel …)
The Main Window is the Configurator Control Center Its menus and sub-menus give access to the other functions.- Assign the link to a Network
From the Main Window you can create a new link and select all relevant parameters in a few Clicks! ,you can copy to the new link Terminal Stations, location data either from an external Excel database or from the Project Station DB in two Clicks!
In all instances PEGASUS shows ALL pertinent data and only the data Pertinent in the Context . Pegasus supports Multi-port Branching Configurations up to 7 + 1 used in Backbone with or without frequency and space diversity.

Link Parameters: Branching, Channels …
For each port you define in the Link Parameters Selector:
• TX Channel
• Polarisation
• Additional TX & RX attenuators when applicable
Also this window allows definition of Hydrometeors (Rain and Water Vapour) and space diversity parameters thanks to the Diversity menu
Pegasus supports Frequency Diversity (N+1 branching configuration) , Space Diversity (receive diversity with two antennas on each side and two or four receivers) and Angle Diversity. Polarisation Diversity (two transmission channels using the same frequency in H and V polarisations.
Of course those microwave link multi-channels configurations are fully taken into account in the interference calculations…
LINK PROFILE ANALYSIS
Microwave Link Profiles might be entered manually, transferred from other environment (Pathloss), automatically read and transferred from the Numerical Terrain Model. The Hop Profile window enables:

Hop Profile with both Fresnel Ellipsoids & terrain
-
Display of both Fresnel Ellipsoids clearances (ITU-R 530-7… methods 1 & 2)
-
Dynamic adjustment of tower and antenna heights (using the mouse) to find the most economical solution to obtain Fresnel Ellipsoid clearance, clearance measurement with cursor coordinates
-
Diffraction Loss calculation when profile is obstructed and diffracted rays viewing
-
study of Reflection areas and of reflection avoidance for profiles over large bodies of waters
-
Four different profile viewing modes, edition of obstacles (type and height)
-
Horizontal Zoom to examine precisely the details of long hops …
A specific Antenna Navigator: click an adjacent hop antenna to view the adjacent hop profile.

Hop Profile

Profile Data 1/2
Profile data of the project links is saved with other project data, it can be imported and edited in the Profile Data Editor
The Profile Data form 1/2 enables:
-
Importing profile data (altitude & coverage) to the project Links from the active NTM
-
Entering and manually modifying Profile Data Points
-
Defining clearance parameters for ITU-R Method I & II
-
Entering measured Difraction Loss
-
Export Profile Data to Clipboard (Excel, Word …) & PL3
The Profile Data 2/2 form enables:
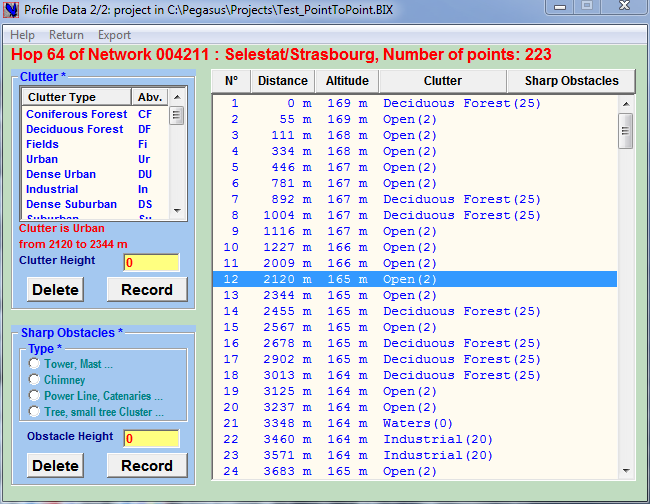
Profile Data 2/2
-
Adding obstacles to the current profile
-
Selecting the obstacle type
-
Change the obstacle height
-
Defining “sharp” obstacles that will be shown on the profile but not taken into account in Profile Clearance: by convention Sharp Obstacles are nearby landmarks that have been checked as not interfering with the Fresnel ellipsoids
If accurate data is not available, it may be convenient to import elevation and clutter data from a precise NTM database or from the SRTM (elevation only)
The obtained profiles will show the areas that should be specially checked during the path profile survey and the profiles will be edited to take into account the survey results.
GOOGLE EARTH EXPORT
You are two clicks aways from viewing the Active Networks in Google Earth, a great feature to check station location and to SEE the nature of Clutter (terrain coverage). It is not a substitute to a good Numerical Terrain Model complete with DEM and Clutter but it is a good complement.

When the clutter information is absent from the Numerical Terrain Model: Google Earth will enable to check the type of cover present along profiles and to make an educated guess about the height of those obstacles.
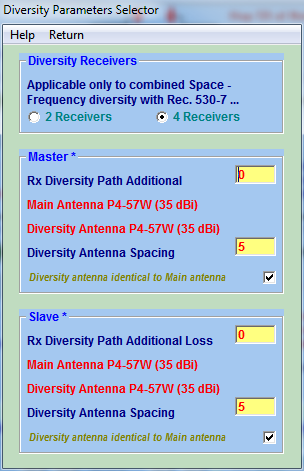
REFLECTION STUDY
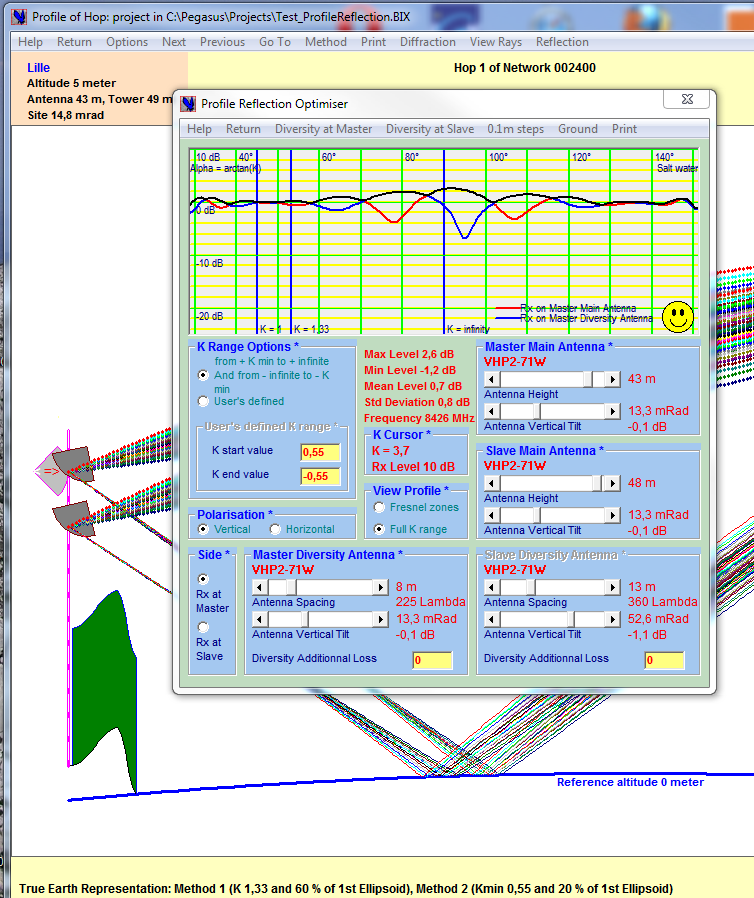
Reflection Parameters Dashboard
The Profile Reflection Optimiser allows Space Diversity Optimisation in function of profile, you can determine the most effective parameters to ensure a fairly high Rx level in spite of Reflections. The different menu items have the following purposes:
– Add or suppress Diversity antenna on the Master/Slave side using the “Diversity at Master/Slave” menus ,
– Change the height change increment of the four sliders that control the heights of Main antennas and the antenna spacing of Diversity antennas with the “0.1m steps” menu
– Select the type of ground on which the reflection is taking place with the “Show Ground” menu.
When diversity becomes necessary, you can play with the sliders that control Main antenna height and Diversity antenna spacing to obtain the best (highest) composite signal all over the K range.
The composite signal (black curve) IS the highest signal received either by the Main or by the Diversity antenna. Note that you can also try some antenna tilting to attenuate some reflections with the advantages of angle diversity.
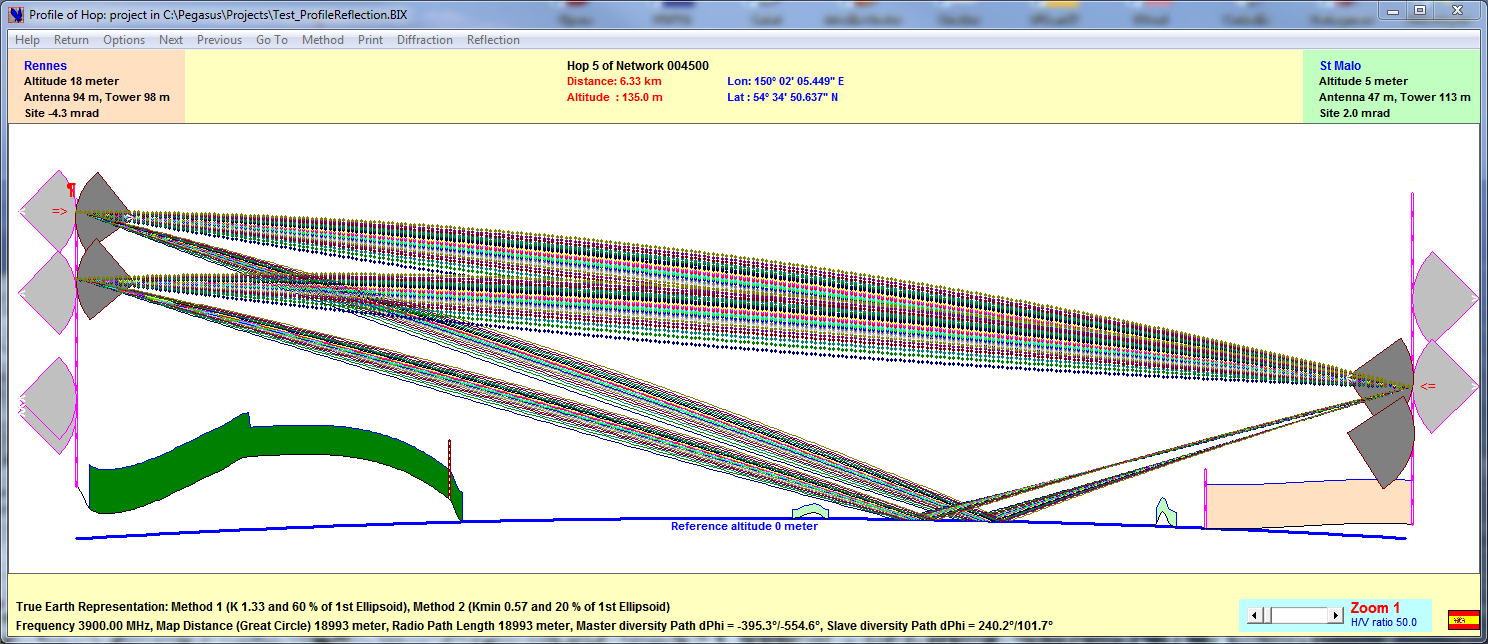
Direct and Reflected Wave Spreading in function of k values
GIS MAP VIEW
The NTM Map “Profile” option enables the user to test profile clearance between two new locations or between an existing project station and a new location. When the Line of Sight seems OK, the user can export the Profile to the current project; it will be associated to a new Link that will be automatically created with default equipment (same equipment as the last link):
-
Compatible with most NTM standards such as PlaNet, geo, bil & hgt (SRTM)…
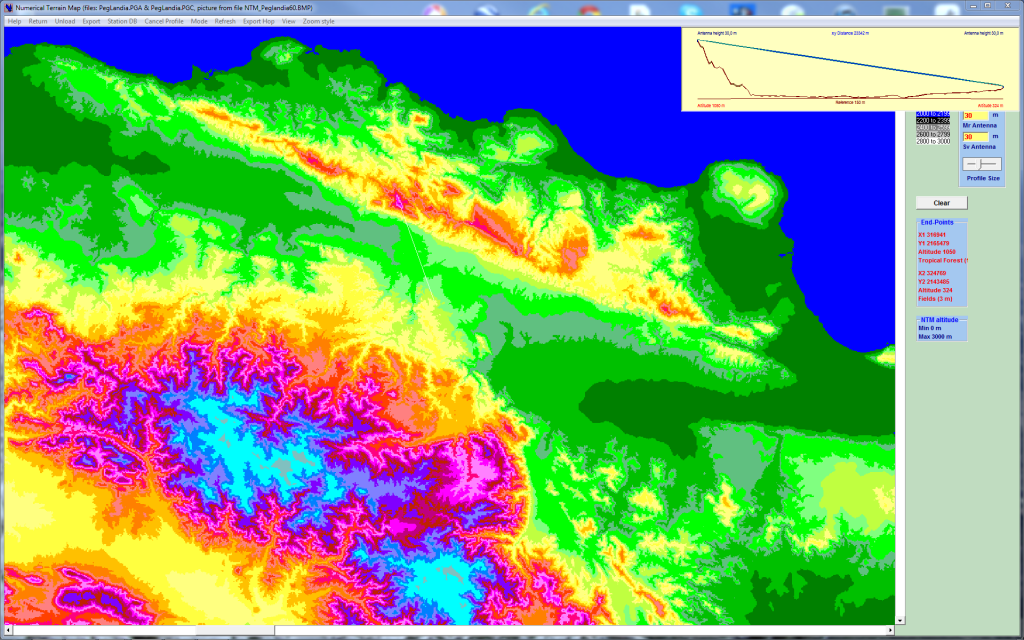
GIS Map View (new profile test mode)
-
Various representations of NTM altitudes and clutter
-
Study of possible link profiles, creation of a new project link directly from the NTM view window
-
Line of site study between a candidate station and an area of interest

-
Station Import from an external database
-
2D & 3 D Zoom
-
Advanced capabilities to search a given area to set up a Nodal connecting several stations, possibility to export the corresponding microwave links to the project.
-
Save\Export the obtained pictures (BMP format) …
In GSM planning a very common task is to find the ideal location for a Nodal station having the Line of Sight with several planned Base Stations.
The two NTM Map options are intended for that:
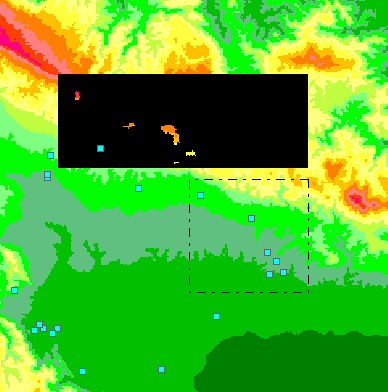
Nodal Search for 6 Stations: nodal in colored areas in black rectangle has LoS
1) ←“Search Nodal Area” help you to select the BS to be connected and plore rectangular area to place the Nodal Station. The coloured area shows all the locations having the LOS with ALL the BS.
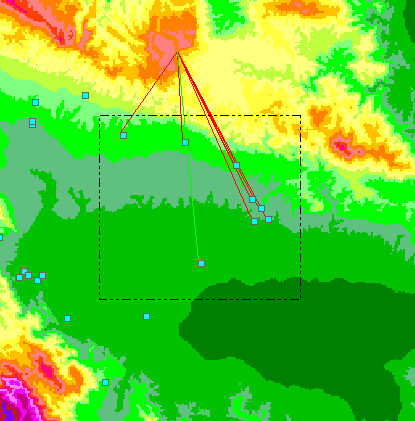
2) ”Export Hops from Nodal”→ perform a similar task; Links without LOS are colored in red, when a location is found with all green LOS lines means that all the new links have LOS and can be exported to the project in one click.
LINK POWER BUDGET
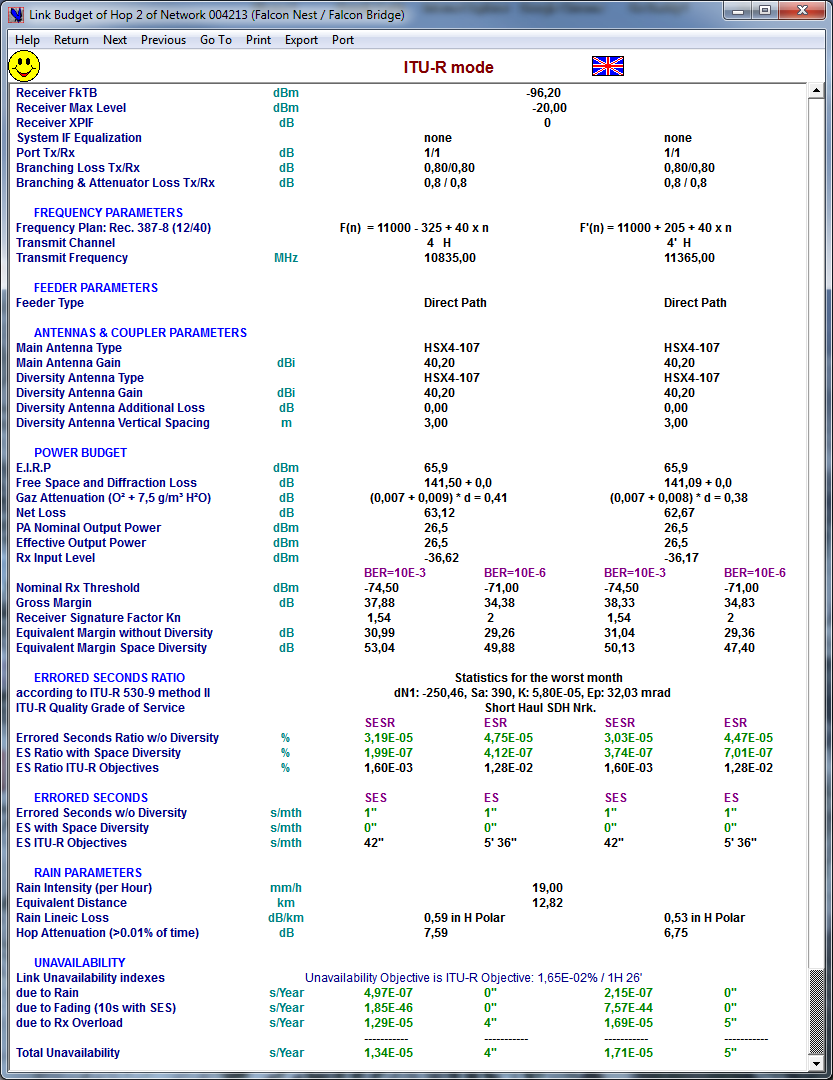
Budget Link of Point-to-Point MW equipment
Instant Link Budget → status display to check if Quality and Availability criteria are met and Full bi-directional power budget analysis that takes into account:
Link Budget for Non-ACM equipment
-
Frequency, Space and Polarisation diversity and their diverses combinaitions
-
Flat & Selective Fading AND Fading Enhancement
-
Interferences (threshold back-off)
-
ATPC, FOP & AOP
-
Rain, atmospheric gases and water vapour losses
-
ACM (Adaptive Modulation and Coding) equipment
-
Separate Link Budgets for each Port of (1 + 0) to (7 + 1) branching configurations
-
Link Power Budget window gives a Synthetic & Concise display of all relevant parameters of equipment, antennas & feeders, Printout and Export of link budget to the clipboard and to text files.
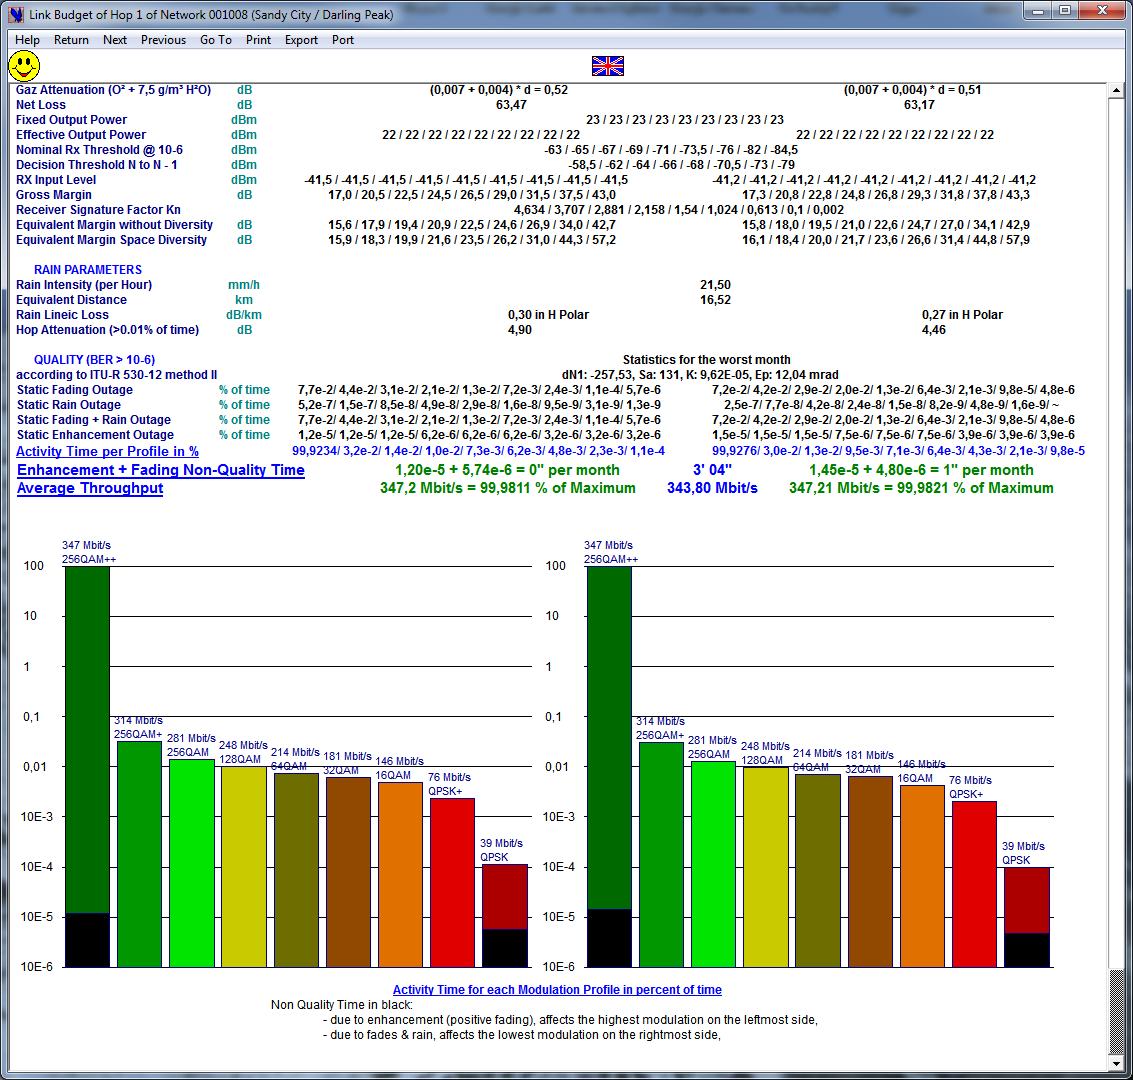
The Link Budget of ACM → gives all details for every Coding/Modulation profile (Static) as well as Activity time per profile and mean capacity (Dynamic).
LINK BUDGET WIZARD


Link Budget Wizard
The Link Budget Wizard will optimize automatically the power budget of all target Links:
-
First choose the optimization Criteria with the option buttons in the Optimization Criterion container.
-
Then define which Links should be optimized with the option buttons in the Target Hops container,
-
Last start the optimization process; click the Begin command button.
-
The Link Budget Wizard will select TX power, antennas and antenna couplers such as to meet the Optimization objectives set for each Link and if necessary, shall use optional equalizers and attenuators, when the Link uses Space Diversity, other diversity antennas might be chosen.
You can note that:
-
the Wizard does not try to adapt the feeder type; feeder type should be selected by the User.
-
you can undo the last optimization process with the Undo menu.
GENERAL ANALYSIS TOOLS
Viewing each Link Budget is great to check in detail the performance of a link, it is not suitable to check at a glance the performance of a subset of networks; for instance of all the Links in the Active Networks as defined by the user.
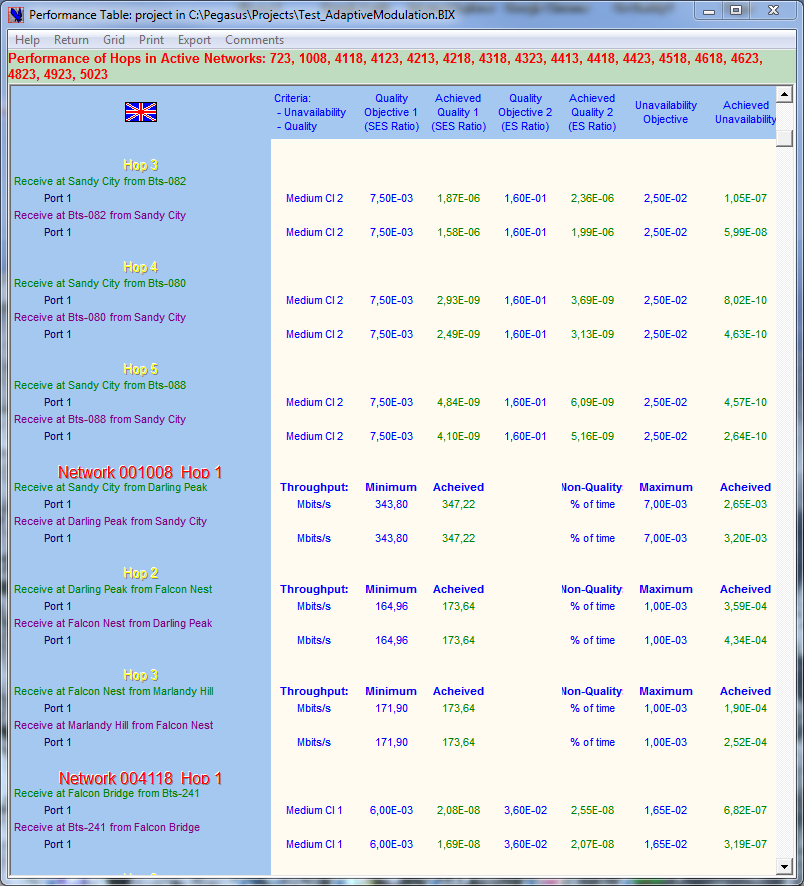
Performance Table
The ← Performance Table is designed for that: it only shows if each Link complies with the assigned Grade of Service, the scrollbar and the green and red colors reflecting GoS compliance enable identifying non-complying links on the fly even when there is a great quantity of active Links.
If you wish to analyse that link, then just click the Link label and the program will display the Main window showing precisely that Link parameters.

Network Quality Matrix
The Quality Matrix→ displays cumulated SES, ES and Unavailability indexes between End Stations of the selected Active Network.
Cumulated means end-to-end sums according to the current Network Hierarchy Tree defined with the “Family Tree” parameters and visible in the GoTo window

Bill of Quantities
The ←Bill of Quantities
Quantity gives for all the Stations of the different Links in active networks the list of microwave equipment, feeders, antennas, towers…This is most useful to cross-check a project for possible inconsistencies and to edit the list of the project equipment either globally or for any set of Networks.
Like many other documents, the BOQ can be exported to Excel via the Clipboard. It is also a great tool to perform financial evaluations …

- Project Station Editor
The Project Station DB→ lists all the stations found in the project. It can be useful to:
-
Correct duplicated entries (station duplicates that differ from the true original by a small detail (a slightly different coordinate, a name misspelling, a different code or ID, a different altitude …) – a very common problem and a common planner’ headache !
-
Correct or modify in one operation all the occurrences of a given station in several Links – a very tedious and consuming task when unaided.
-
Copy to a new Link station’s name and coordinates if that station is already used in the project.

copy stations from the External Station Database
The ← External Station DB enables importing into Pegasus, station data from an XLS spreadsheet: as shown here any station listed in the database can be copied to the current link.

importing to the GIS from an External Station DB
The External Station DB→ can also be used in the GIS Map view environment to import stations directly on the GIS map, once exported there, it is easy to test profile clearance between imported stations, between an imported station and any other project station and between an imported station and any other location on the map. When a satisfactory profile is found, it could be exported to a new link.

DB Report Editor
The ←Report Editor enables Editing Specific Reports to the intention of different entities involved in a transmission group (Project Managers).
The DB Report Editor enables the user to creating up to 99 different forms of reports in Excel XLS format.
An Excel Report template has to be created first by selecting the desired fields from a list of 141 different exportable fields listed in REPORT01.XLS. Once this is done, only two clicks will suffice to produce the requested Excel Report. Once the Report Template has been created it can be used session after session.

INTERFERENCES CALCULATIONS

Frequency Plan Analyzer (detection of Parity Violations)
For each Station location the Frequency Plan Wizard→ analyses all the TX frequencies (towards Slaves) and Rx frequencies (from Masters). The Frequency Plan Wizard ignores completely the Family relations as defined in the Family Tree; the analysis is purely based on the analysis of geographical coordinates and frequency plans. It is essential to use this Wizard before starting Interference Calculations to screen out flagrant Parity Violations.
The Frequency Plan Wizard can also fix parity violations by swapping parities of the concerned TX or RX channel. You just have to click the TX or RX Line to change the parity and to start another parity check !
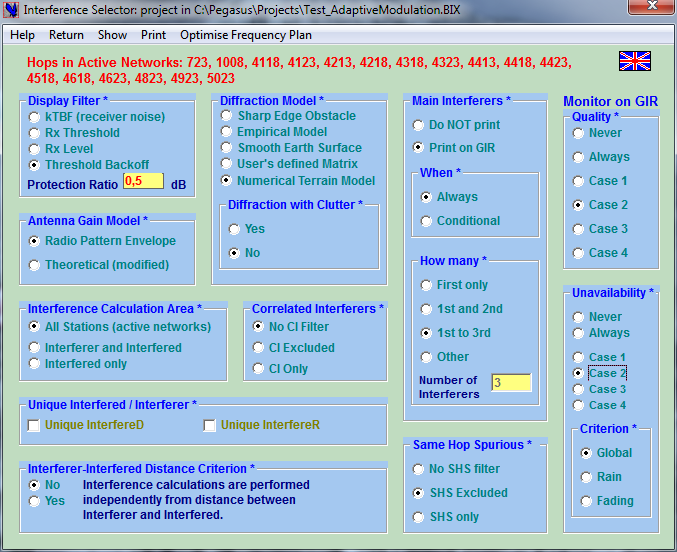
Dashboard Interference Selector
We may now launch the ←Interference Selector and configure the set of advanced features:
-
Definition of the criterion used to characterize unwanted interferences (most usually the threshold back-off)
-
Select one of the several methods available to calculate protection due to diffraction including TRUE diffraction calculations when a NTM is loaded
-
Discrimination of same path interferers (path correlation)
-
Numerous filters that screen unnecessary calculations and reduce CPU time.
-
Full set of options to edit DIR and GIR. The Detailed Interference Report gives all details on each interference case; the Global Interference Report gives the cumulated impact on each receiver in every link and can list its Main Interferers
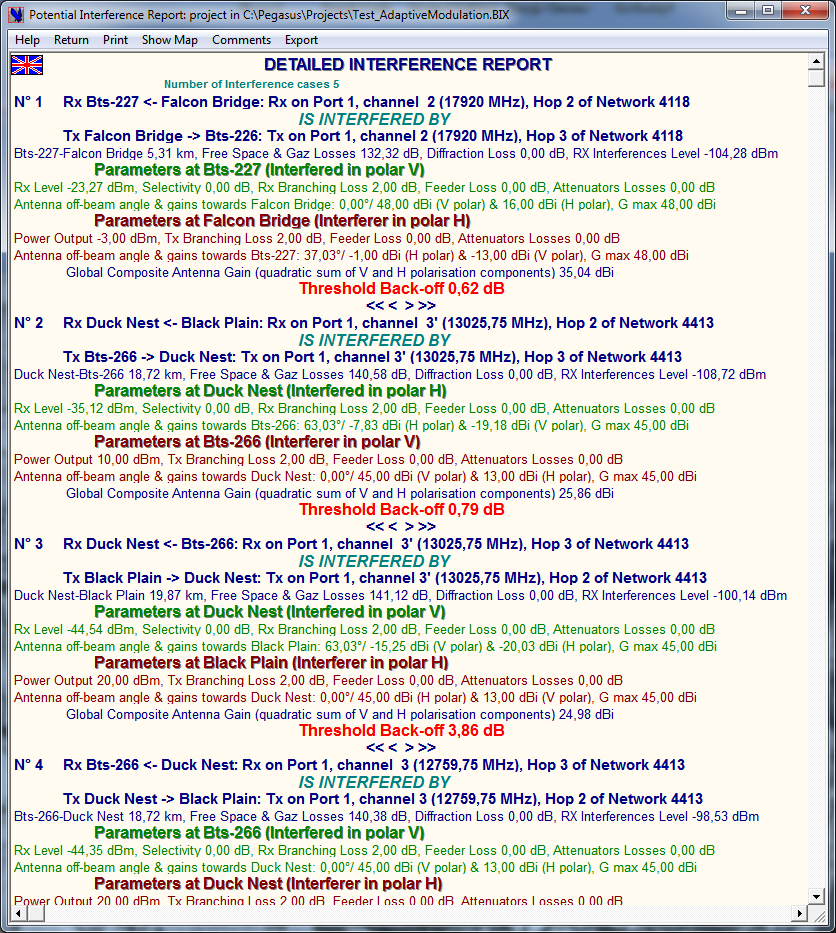
Dashboard Interference Selector
The Detailed Interference Report (DIR) lists all the interference cases that are above the chosen value for the display criterion; the information displayed for each case should help the user to find the best means to lower the interference value:
-
Identification of the interferer TX and of the victim RX
-
TX & RX frequencies, hop length & attenuation
-
Diffraction loss and level of received interference
-
Victim RX polarisation
-
Received level, Selectivity (IRF)
-
Victim RX branching, feeder & attenuators losses
-
Victim RX antenna off-beam angle and off-beam gains in H & V polarisations
-
Interferer TX polarisation, Power Output Level
-
Interferer TX branching, feeder & attenuators Losses
-
Interferer TX antenna off-beam Angle and off-beam Gains in H & V polarisations.
By clicking the text of an interference case you open the Interference Optimisation Parameters Selector…
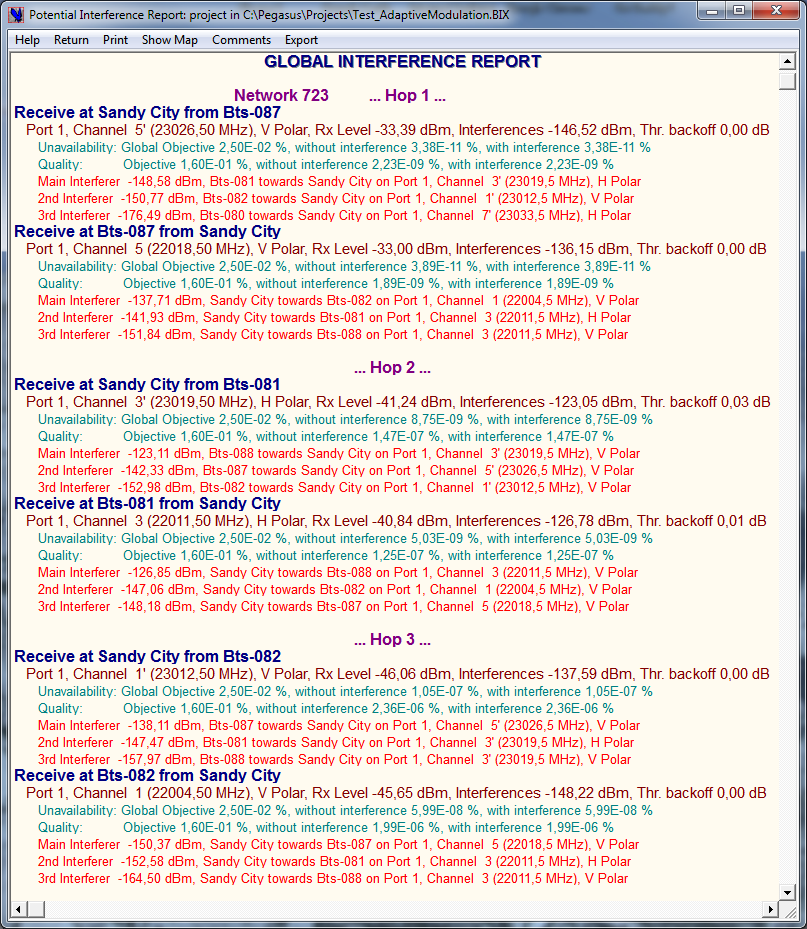
Global Interference Report (GIR)
The ←Global Interference Report lists all the active project Links and displays for all the RX ports:
-
The RX frequency and the RX level
-
The quadratic sum of received interferences
-
The characteristics of the highest interferers by decreasing order of nuisance:
-
The level of received interference from that interferer
-
The full address of the TX interferer
-
The channel number, the corresponding frequency and the polarisation
By clicking the Link number line you open the Interference Optimisation Parameters
Selector…
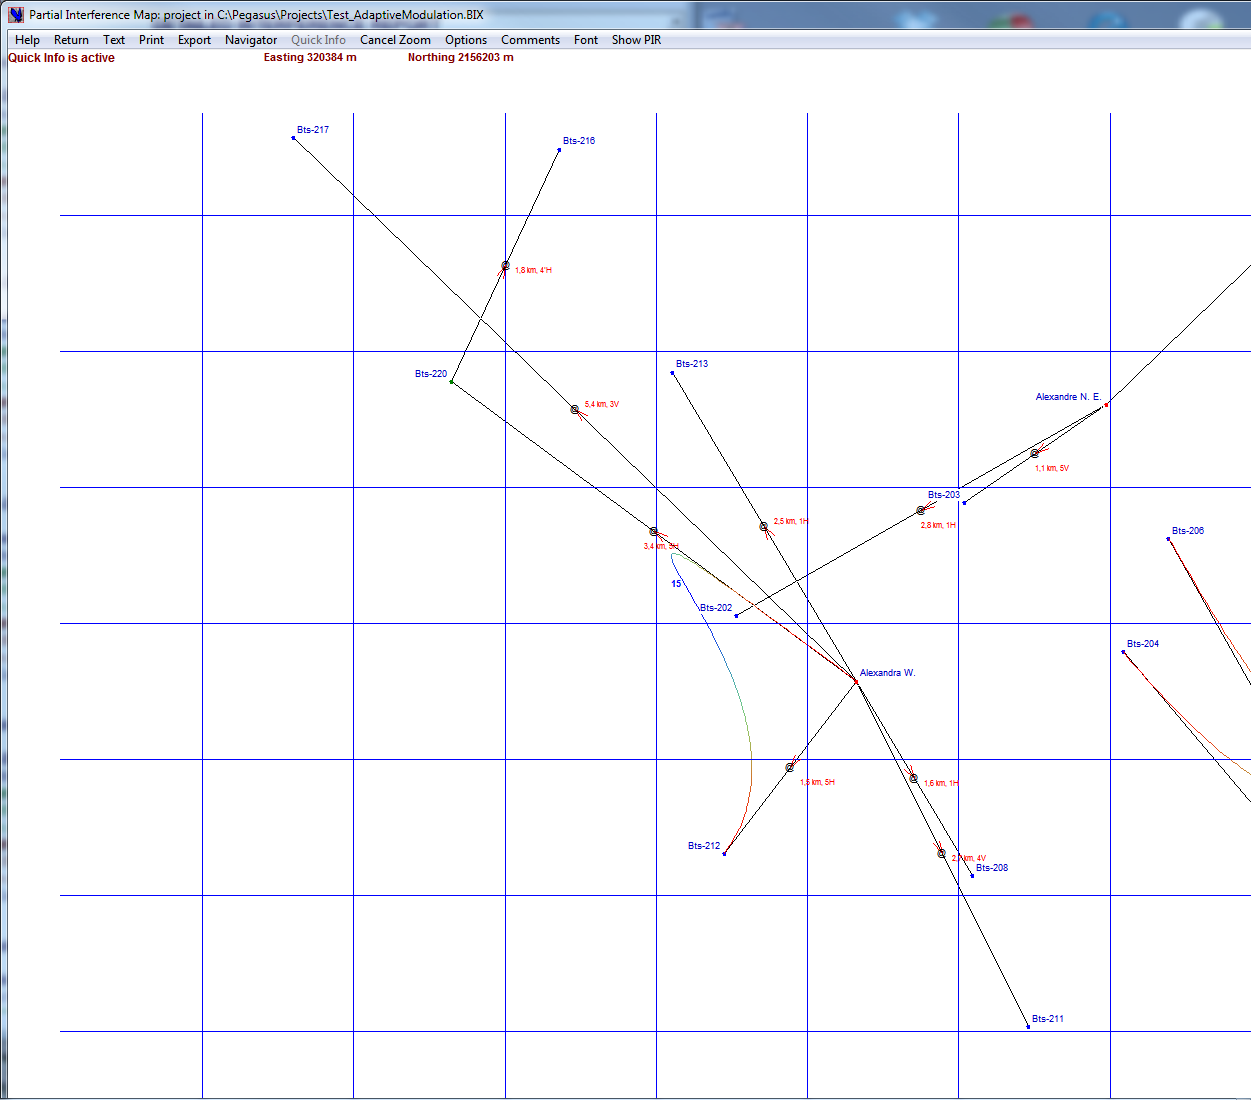
Interference Map (partial)
The Interactive Interference Map→ has several functions:
Viewing the general outline of the project Links
“Click and Go”: easy navigation between the different link in the project
“Click and View”: viewing detailed information on any selected link
Zooming any portion of the map and zooming the zoom (zoom in zoom)
User-friendly interference graphical representation including detailed channel and polarisation lay-out to understand any interference situation
- Interference Optimization Parameters Selector
←Interference Optimisation Parameters Selector enabled the User to choose the optimisation parameters (Preferred Channels …) and to launch the Interference Optimization procedure (Optimize Hop menu) that will start iterative interference calculations and display the Potential Interference Report
We mentioned, that from the DIR, clicking the text of an interference case opens the Interference Optimisation Parameters Selector and, that from the GIR, clicking the Link number line opens the same Interference Optimisation Parameters Selector…

Potential Interference Report
The Potential Interference Report→ analyses all the possible channel / polarisation arrangements for a given Link and propose the solution that gives the best results that is the minimum number of interferences caused and received by the Link being optimised, taking into account the Preferred Channels defined for that Frequency Plan or among frequencies in any other frequency subset chosen by the user.